
STOCK MARKET:
Shocking 25-Year Stock Market Decline: The Hidden Wealth Trap You’re Still In (2000–2025)
Imagine investing your life savings at the peak of the dot-com boom in early 2000, only to watch the market tumble, stagnate, and take over a decade just to break even.
Fast-forward to 2025, and the shocking 25-year stock market decline still haunts long-term returns in ways most investors ignore.
While recent headlines scream about record highs, the full picture from 2000 to 2025 reveals a far less glamorous story of muted real growth, brutal volatility, and a hidden wealth trap that could still be costing you thousands every year.
What the Shocking 25-Year Stock Market Decline Actually Looks Like
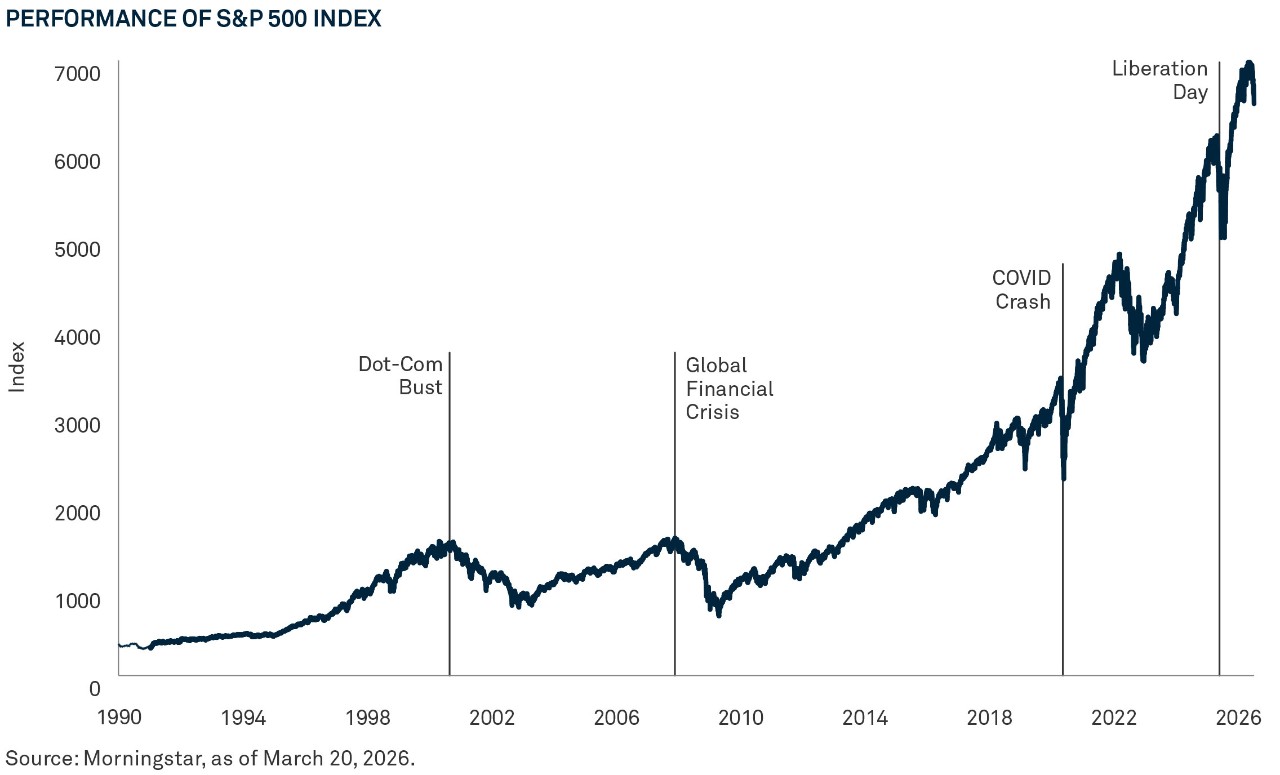
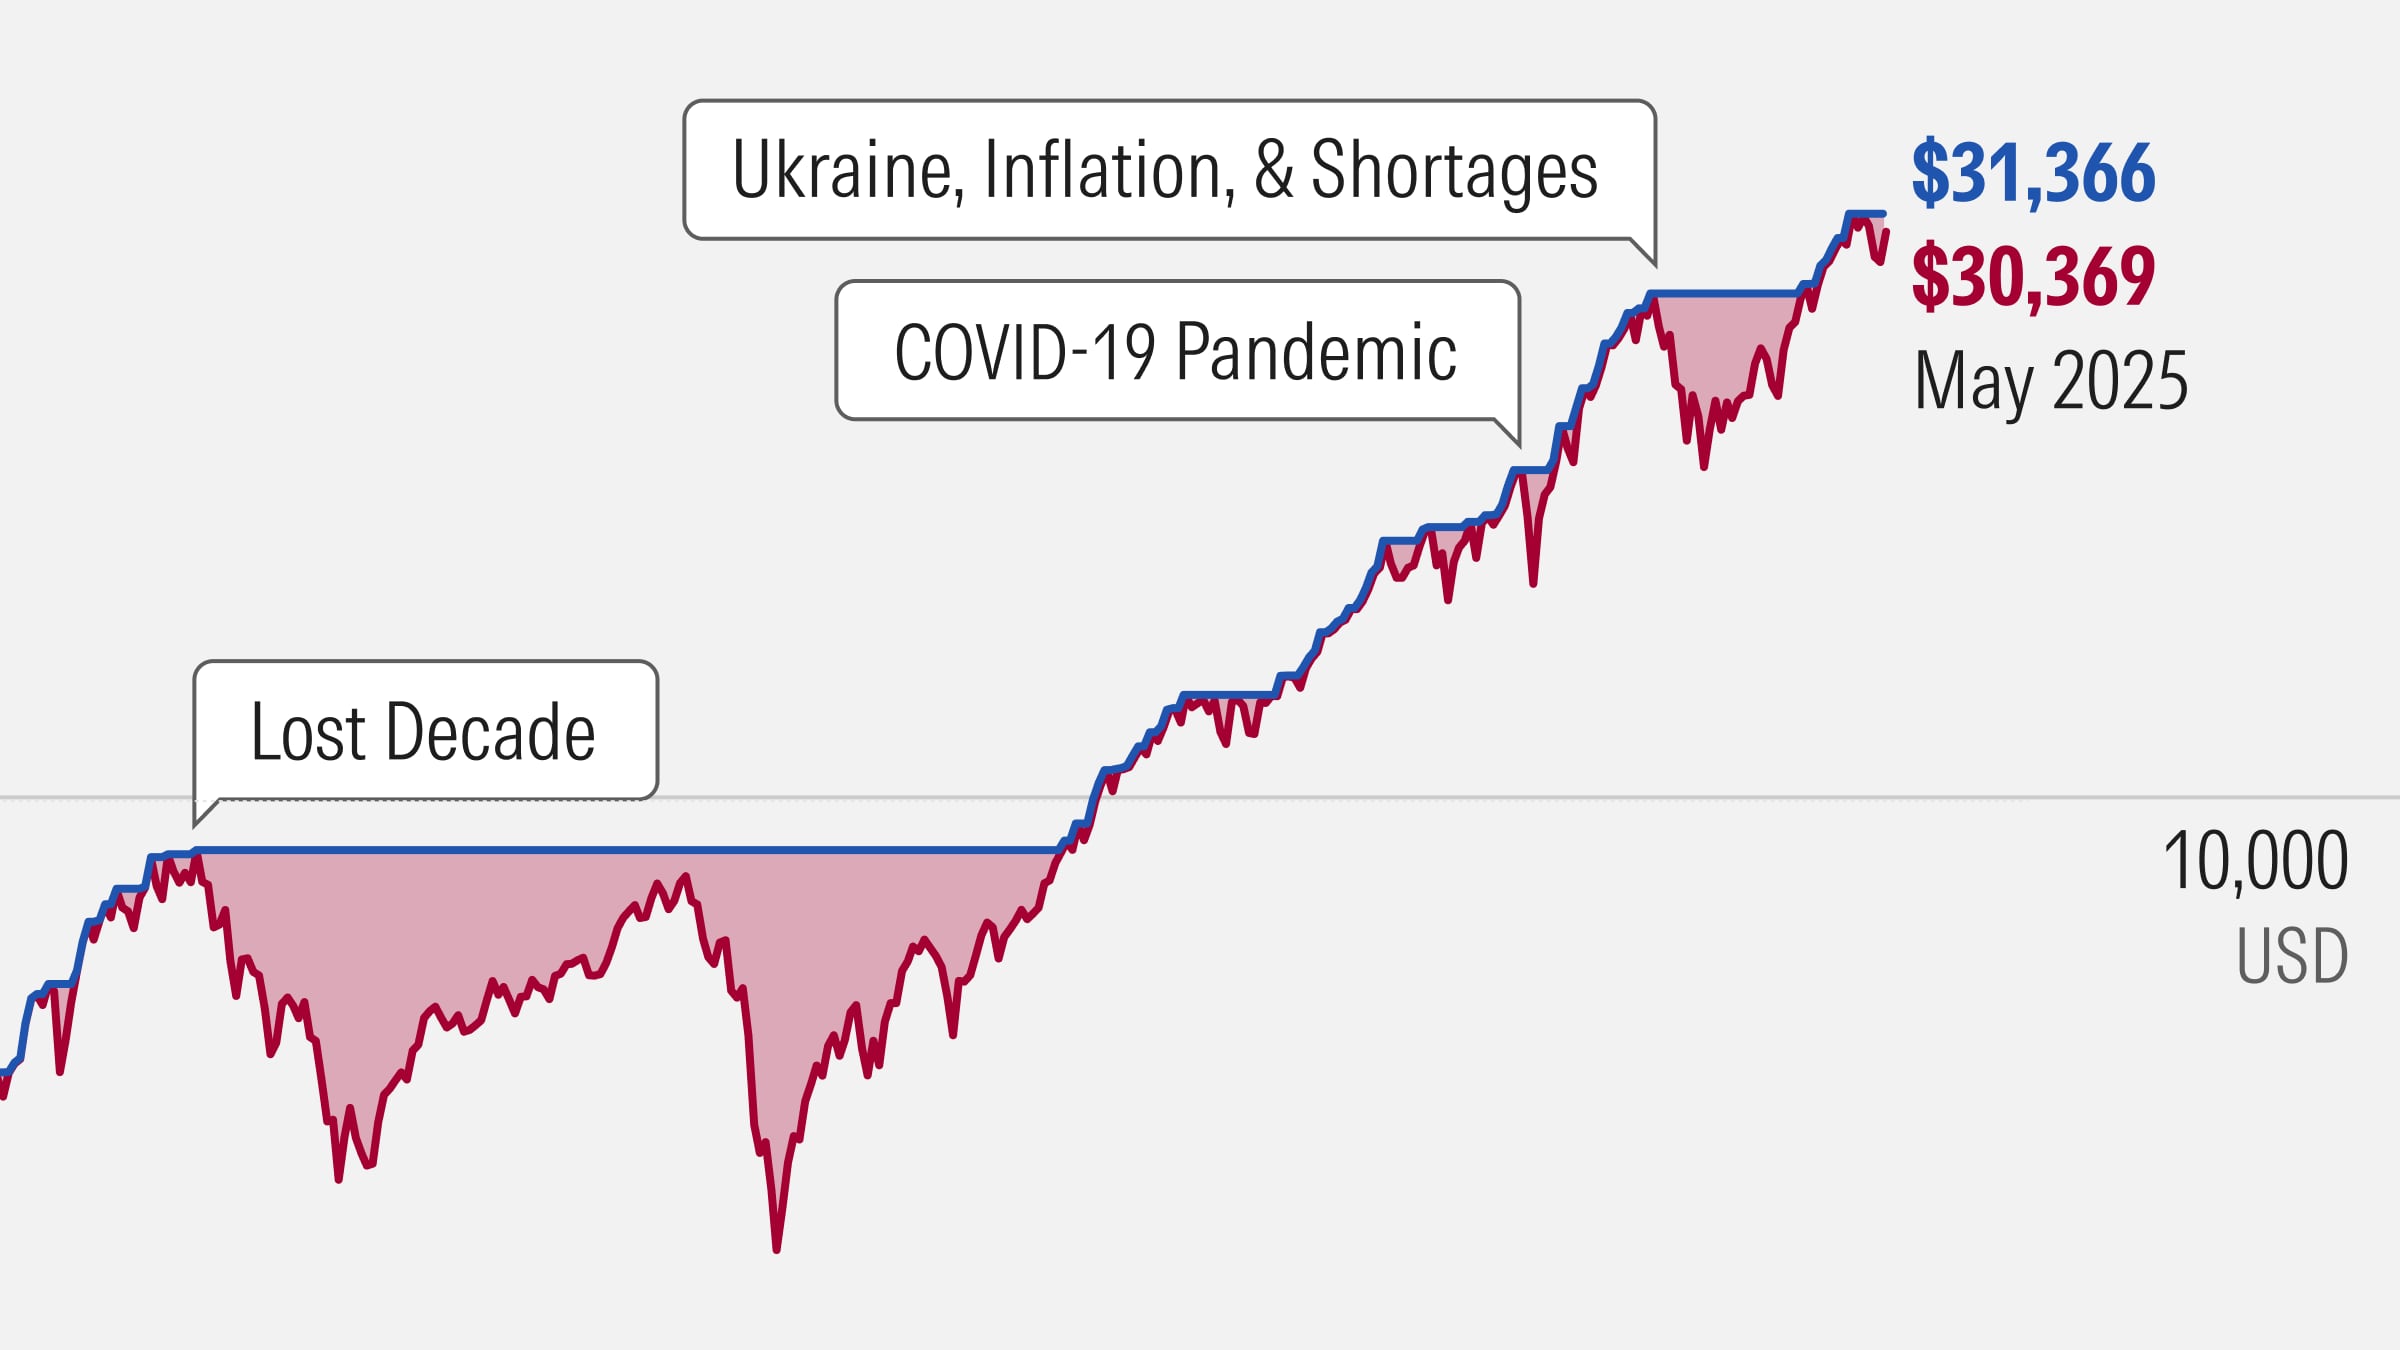
The shocking 25-year stock market decline isn’t a straight-line crash—it’s the slow grind of two major bear markets, a “lost decade,” and inflation quietly chipping away at your purchasing power.
If you had invested $1,000 in the S&P 500 at its March 2000 peak, your nominal total return (with dividends reinvested) would have grown to roughly $5,720 by early 2025. That sounds solid on paper, about 7.26% annualized.
But adjust for inflation, and the real return drops to around 4.66% per year. Your $1,000 now buys only about $3,102 in 2000 dollars.
That’s the hidden reality behind the shocking 25-year stock market decline.
As this detailed chart from Advisor Perspectives illustrates, the path was anything but smooth.

Breaking Down the Lost Decade That Started It All
The shocking 25-year stock market decline really kicked off with the dot-com bust. From 2000 to 2009, the S&P 500 delivered a negative total return of about -1% per year nominally, and even worse when inflation is factored in.
Many blue-chip tech names from the late ’90s never fully recovered for years.
Then came the 2008 financial crisis, which sent the index plunging nearly 37% in a single year.
By the end of that “lost decade,” investors who stayed the course were essentially back to square one in real terms.
Yet most financial media today glosses over this period, focusing instead on the strong rebounds since 2010.
This selective memory creates the first layer of the hidden wealth trap: recency bias that makes you believe stocks always deliver double-digit gains without the pain.
How the Shocking 25-Year Stock Market Decline Still Shapes Today’s Returns
Even with the powerful bull runs of the 2010s and 2020s, the full 25-year window drags the average down.
Long-term historical S&P 500 returns sit around 10% nominal and 7% real annually.
The 2000–2025 stretch lands closer to 7.7% nominal and 5.1% real, respectable, but nowhere near the “set it and forget it” wealth machine many assume.
That gap matters more than you think.
Compounded over decades, it can mean hundreds of thousands of dollars less in retirement.
And because so few people discuss the shocking 25-year stock market decline in polite investing circles, most savers remain unaware they’re still inside the hidden wealth trap.
The 7 Hidden Layers of the Wealth Trap You’re Probably Still Caught In
The shocking 25-year stock market decline exposed several behavioral and structural traps that continue to drain wealth today. Here they are, broken down clearly:
- Behavioral panic during crashes: Millions sold near the 2002 and 2009 bottoms, locking in permanent losses while missing the subsequent recoveries. Studies show the average investor underperforms the market by 1.5–2% annually due to bad timing alone.
- Inflation’s silent erosion: Even “positive” nominal returns can feel like a decline when real purchasing power barely budges. Over 25 years, cumulative inflation turned modest gains into break-even scenarios for many.
- High fees and mediocre active funds: Many 401(k) investors still pay 1%+ in expense ratios on funds that trail the S&P 500. That 1% fee compounds into a massive drag, potentially halving your nest egg over 25 years.
- Taxes on dividends and capital gains: Without tax-advantaged accounts, every distribution and sale triggers a bill, quietly reducing the shocking 25-year stock market decline’s net benefit.
- Over-concentration in a few mega-stocks: Today’s market is more top-heavy than in 2000. A reversal in tech or AI could echo the dot-com fallout.
- Sequence-of-returns risk for retirees: If you retired around 2000 or 2008, early portfolio withdrawals during downturns permanently damaged your nest egg—regardless of later rebounds.
- Opportunity cost of staying sidelined: Fear from past declines keeps some investors in cash or bonds, missing compounding entirely.
These aren’t theoretical risks. They’re the exact mechanisms behind the hidden wealth trap still active in 2025.
Real vs. Nominal: Why the Numbers Lie Without Context
To make the shocking 25-year stock market decline crystal clear, let’s look at the data side by side.
| Period | Nominal Annualized Return | Real (Inflation-Adjusted) Return | $10,000 Grows To (Nominal) | $10,000 Grows To (Real 2000 $) |
|---|---|---|---|---|
| 2000–2009 (Lost Decade) | -1.0% | -3.4% | ~$9,100 | ~$7,200 |
| 2010–2019 | 13.6% | 11.2% | ~$37,000 | ~$28,500 |
| 2020–2025 (partial) | ~18% (strong bull) | ~14% | ~$22,000 (on prior base) | ~$18,000 |
| Full 2000–2025 | 7.7% | 5.1% | ~$66,100 | ~$25,400 |
(Data synthesized from Macrotrends, Advisor Perspectives, and inflation-adjusted S&P 500 sources.)
The table shows why the shocking 25-year stock market decline feels invisible: strong recent years mask the earlier pain. Yet the real purchasing power gain is far more modest than most assume.
Lessons from Other Assets: Stocks Weren’t the Only Game in Town
During the shocking 25-year stock market decline period, some alternatives actually delivered stronger real returns in stretches.
Gold, for instance, outperformed the S&P 500 on a total-return basis in certain rolling 25-year windows ending around 2025, especially when inflation spiked.
Real estate (via home prices or REITs) provided income and appreciation that sometimes beat stocks after inflation.
This doesn’t mean abandon stocks, it means the hidden wealth trap includes over-reliance on a single asset class that endured prolonged flat periods.
Why Nobody Is Talking About the Shocking 25-Year Stock Market Decline
Recency bias is powerful.
Financial media thrives on “new highs” and “record bull runs.”
Admitting that a full generation of investing (2000–2025) delivered below-average real returns doesn’t sell newsletters or ad clicks.
Plus, many advisors prefer highlighting the post-2009 recovery because it makes their clients feel smart.
But ignoring the shocking 25-year stock market decline leaves you vulnerable to repeating the same mistakes when the next bear market arrives.
How to Escape the Hidden Wealth Trap Starting Today
The good news? You don’t have to stay trapped.
Here’s a practical, step-by-step plan to break free from the lingering effects of the shocking 25-year stock market decline:
- Rebalance with real returns in mind: Calculate your portfolio’s inflation-adjusted performance annually, not just nominal.
- Minimize fees ruthlessly: Switch to low-cost index ETFs or target-date funds with expense ratios under 0.10%.
- Tax-optimize everything: Max out IRAs, 401(k)s, and HSAs to shelter dividends and gains.
- Dollar-cost average consistently: Avoid trying to time the market, systematic investing smooths out volatility.
- Diversify beyond U.S. large-caps: Add international stocks, small-caps, value tilts, and alternative income sources.
- Build a cash-flow buffer: Keep 1–2 years of expenses in safe assets so you never sell stocks in a downturn.
- Review your behavior: Track your actual investor returns versus the market using free tools, most people discover they’re leaving money on the table.
Implement even three of these, and you’ll start compounding ahead of the hidden wealth trap instead of inside it.

The Future Outlook: Will the Next 25 Years Repeat the Same Pattern?
No one can predict exactly, but current valuations (high CAPE ratios) suggest future returns may resemble the more modest 2000–2025 era rather than the roaring 2010s.
That makes escaping the hidden wealth trap even more urgent now, while markets are still near highs.
Final Thoughts: Don’t Let the Shocking 25-Year Stock Market Decline Define Your Future
The shocking 25-year stock market decline from 2000–2025 wasn’t just a historical footnote.
It exposed how volatility, inflation, behavior, and fees can quietly drain wealth for an entire generation of investors.
Yet the same period also proved that patience and smart habits win in the end.
The hidden wealth trap is real, but it’s not permanent.
Take one action today: pull up your portfolio, run the inflation-adjusted numbers, and commit to at least one fix from the list above.
Your 2050 self will thank you.
Share Now if this opened your eyes to the shocking 25-year stock market decline most people miss.
Drop a comment below: Were you invested during the lost decade, and what lesson stuck with you most?
Let’s keep the conversation going, because awareness is the first step out of the hidden wealth trap.